Orbital Africa was contacted and contracted on 12th September 2024 to execute detailed topographical survey on a 1-Acre property in Kitisuru, Nairobi County. The main objective of the assignment was to perform the ground geospatial evaluation as well as conduct a detailed topographical survey of the property in order to ascertain the magnitude of the damages experienced on the property which arose due to Elnino rains experienced during the months of March to May 2024. Accordingly, we employed high precision GNSS/RTK equipment to conduct the survey as per the client’s scope of works as outlined in subsequent sections. The project was conducted expeditiously and successfully by Orbital Surveyors within three (3) days as per the contract agreement.
Objectives
The main objective of this project was to conduct a detailed topographical survey using GNSS/RTK equipment to map and pick the terrain data, spot heights and topo features such as trees, pavements, and footpaths among others. Specifically, the project was aimed at:
- The identification and location of features such as spot heights, walls, trees, river and other major features.
- Execution of detailed topographical survey on the 1 acre (approx.) with contour lines at a minimum of 30 centimeters incremental intervals; or 60 centimeters contour levels picking of topographical features on the ground, spot heights or terrain data.
- Identification of landmarks such as trees which were destroyed by surface run-off and documentation thereof.
- Data Processing and creation of topographical and contour maps in CAD and GIS software and
- Preparation of detailed project report with data analysis key findings and recommendations.
Topographical Survey
The field survey was conducted on 14th September 2024. The general boundary establishment and property extents was also done by identifying the beacons of the parcel on the ground. The acreage of the parcel was also confirmed using the coordinates of the corner beacons and its associated boundaries. The detailed topographical survey was conducted using SunNav S90 GNSS receiver by adopting RTK survey method and Muya CORS network. The CORS station is located at approximately 11.5 kilometres from the site. This was important in ensuring high positional accuracy was maintained throughout project execution phase. Before the task of picking the topo features began, the GNSS localization was done with one of the Survey of Kenya pillars located about 1 kilometre from the property. This ensured that topo survey was tied to the Kenya national grid.
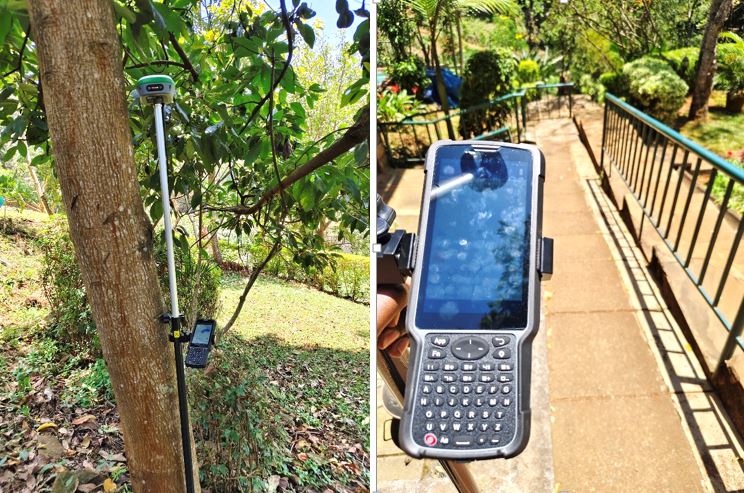
The RTK survey method was adopted during the survey. Both horizontal and vertical (elevations) topographical data was collected by the GNSS. Prior to conducting the topo survey, the GNSS rover configurations were done enabling the connection between the receiver and data logger via Bluetooth communication. Consequently, the logger was connected to the internet via mobile hotspot making it possible to receive RTK corrections from the CORS network via NTRIP protocol. The Networked Transport of RTCM via Internet Protocol (NTRIP) is a protocol for streaming Differential GPS (DGPS) corrections over the Internet for the Real-time Kinematic positioning. NTRIP is a generic, stateless protocol based on the Hypertext Transfer Protocol HTTP/1.1 and is enhanced for GNSS data streams.
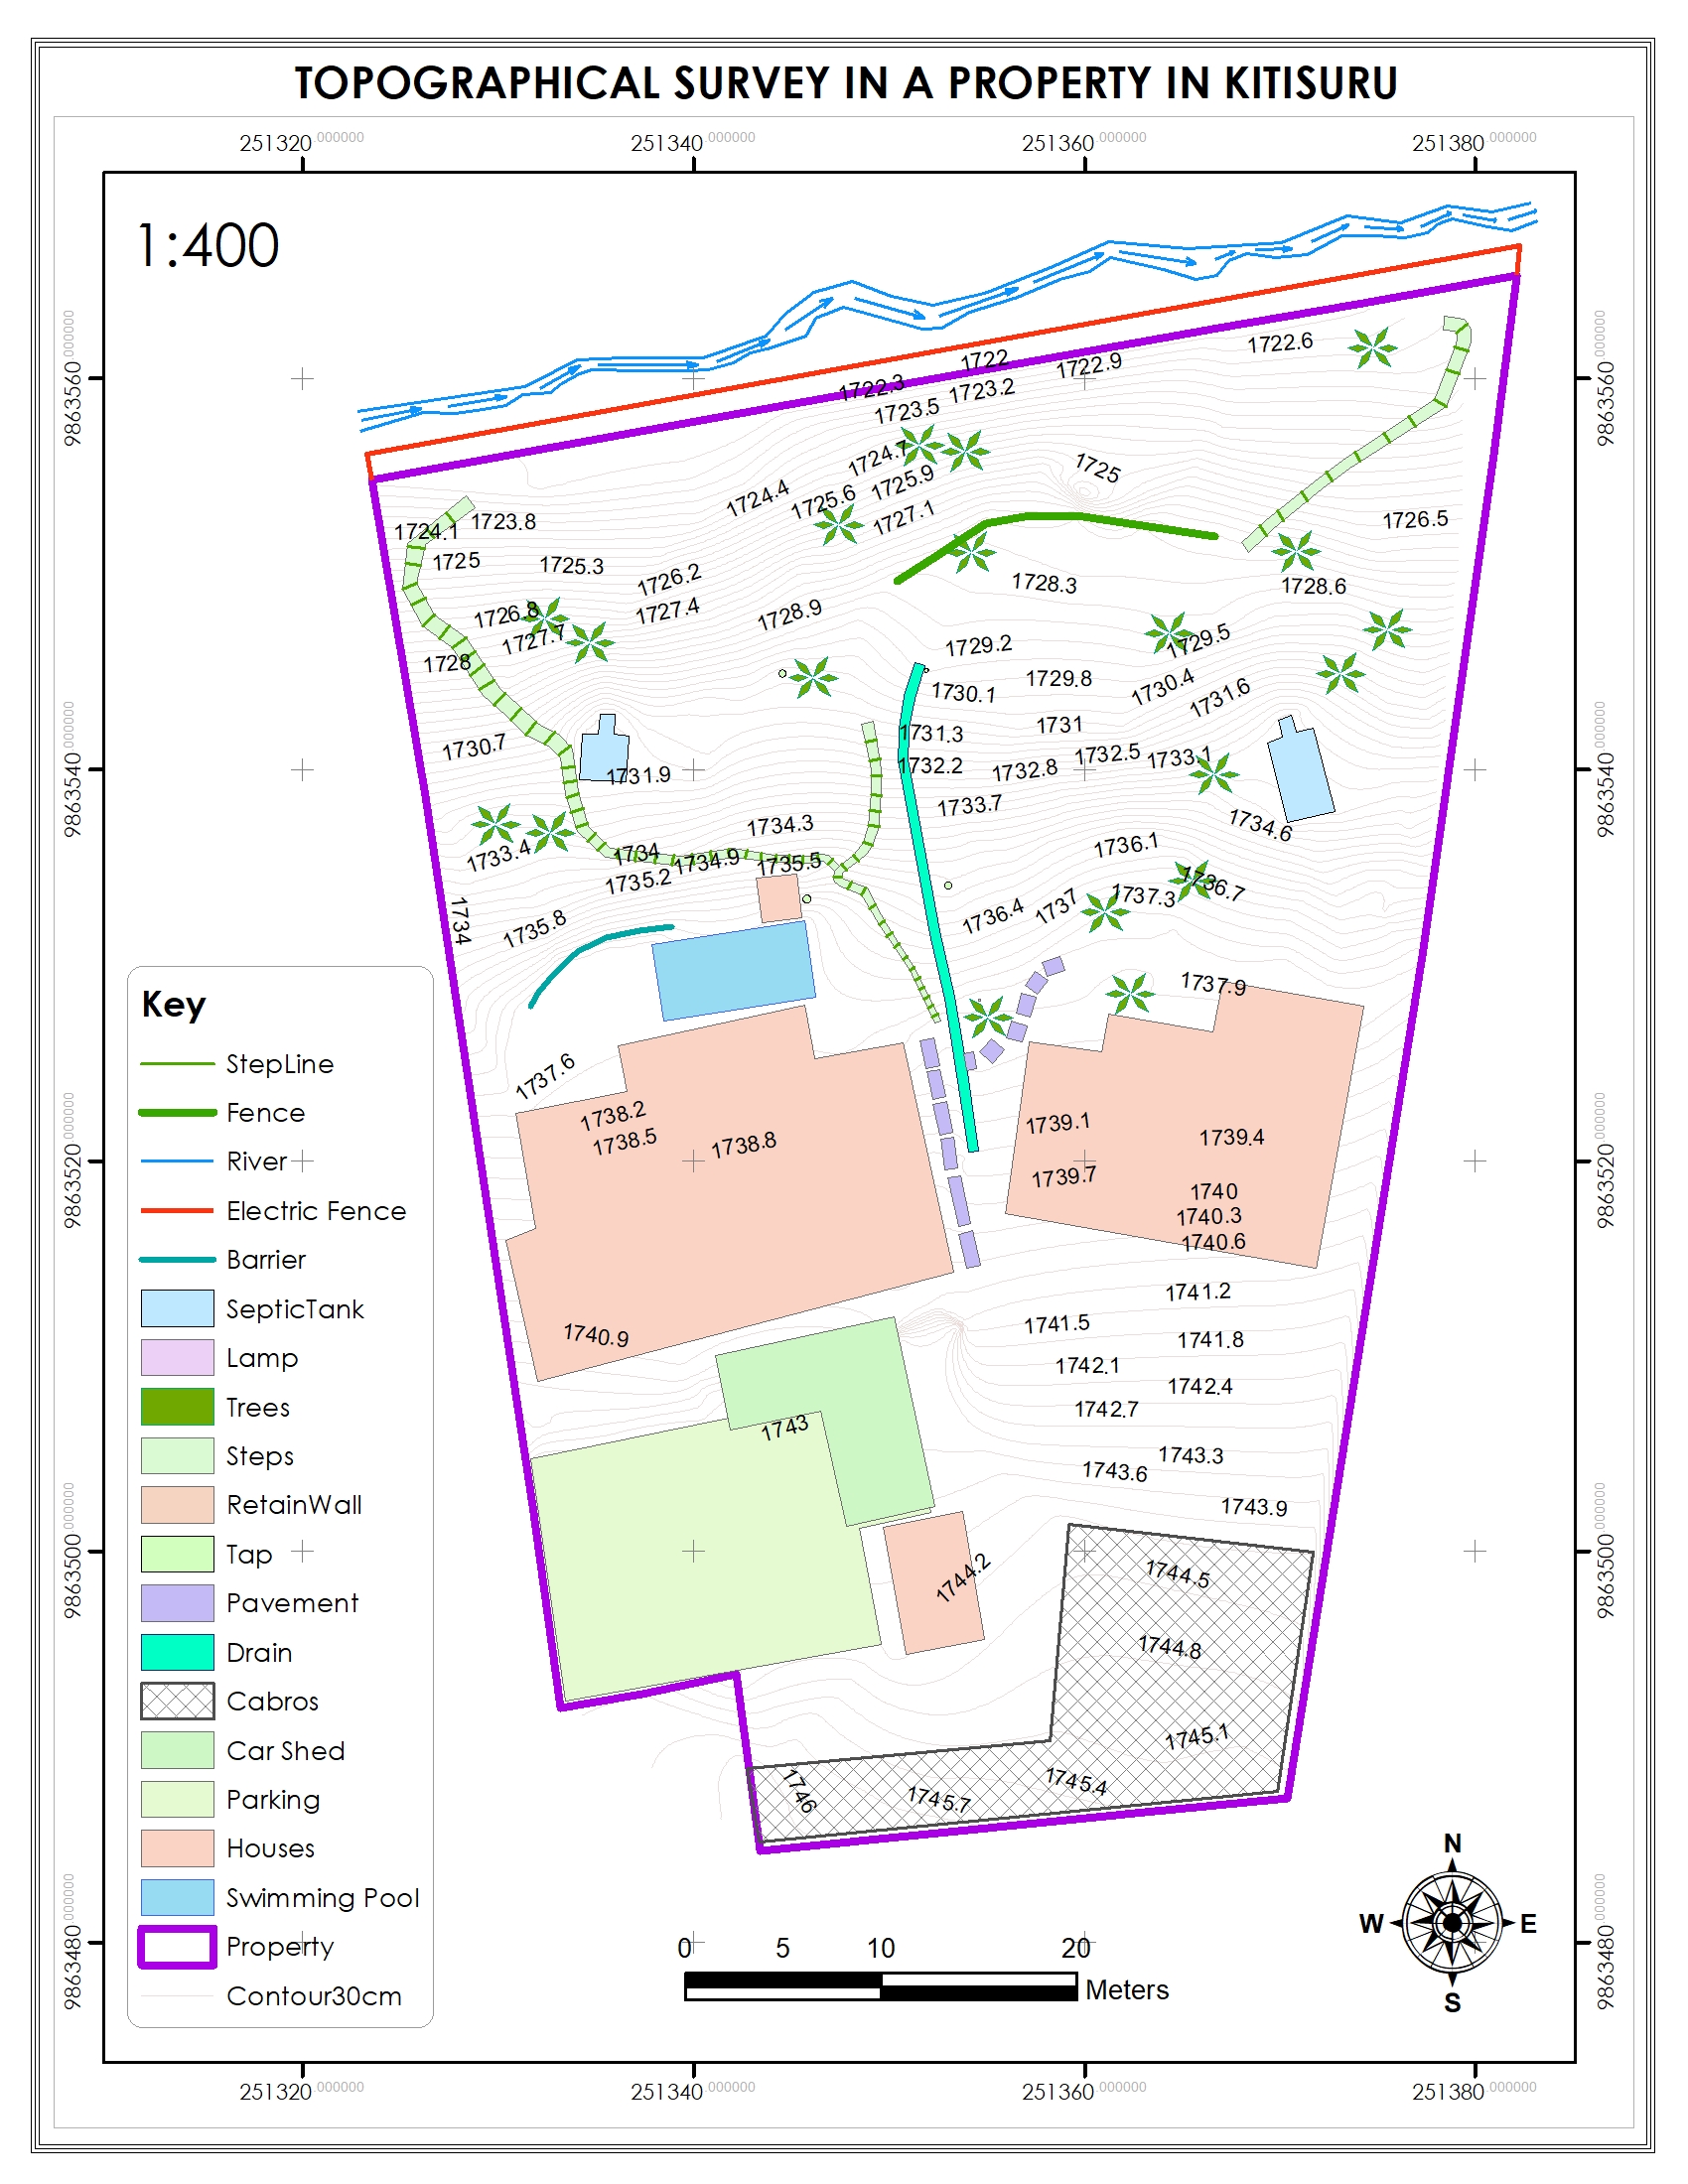
Adopting CORS as the source of real time corrections enabled the surveyor to swiftly conduct the topographical survey of the entire project area thus attaining the horizontal and vertical accuracies of ±0.04 m and ±0.02 m respectively. The local datum adopted was Arc1960. The Universal Transverse Mercator (UTM) projection was used for horizontal positioning and Clarke 1880 (modified) ellipsoid for vertical positioning. The topo features picked during the survey include the spot heights, trees, drains, swimming pool, water flow channels, and walls among others. The topo data collected was downloaded from the GNSS and analysed before postprocessed in ArcGIS and AutoCAD Civil 3D software.
Data Processing
During the topo survey, a total of 275 well-spaced ground points were picked hence obtaining their respective coordinates in x, y and z. The data was analysed and processed to obtain outputs such as terrain model, contours, land and topographical maps (See appendices section). The contour interval adopted was 30cm (0.3m). The ArcGIS software was used for spatial analysis and processing of the collected coded field data thus obtaining various outputs such as elevation data and topographical maps. The table below shows sample topographical data collected during the survey.
Table 1: Sample Field Data
|
ID |
Northing (M) | Easting (M) | Elevation (M) |
Feature Description |
|
1 |
9863488.846 |
251342.732 |
1746.220 |
Gate |
|
2 |
9863484.647 |
251343.394 |
1746.159 |
Gate |
|
3 |
9863487.222 |
251345.792 |
1745.910 |
Spot Height |
|
4 |
9863489.699 |
251344.029 |
1745.767 |
Spot Height |
|
5 |
9863491.096 |
251345.588 |
1745.642 |
Spot Height |
|
6 |
9863487.467 |
251352.360 |
1745.553 |
Spot Height |
|
7 |
9863492.660 |
251337.371 |
1745.418 |
Gate |
|
8 |
9863486.667 |
251363.570 |
1745.381 |
Retaining Wall |
|
9 |
9863492.061 |
251333.441 |
1745.339 |
Gate |
|
10 |
9863488.021 |
251370.514 |
1745.151 |
Retaining Wall |
ArcGIS software was used for data processing and plotting of topographical features on the map. An A0 size topo map was also prepared as one of the outputs as indicated in the Appendices section. The elevation data was also represented by the contours and Digital Elevation Model (DEM).
Data Analysis
The data analysis was done in both ArcGIS software. In the context of data analysis in this project, we focused on both the Terrain and Elevation analysis as presented in the following sections.

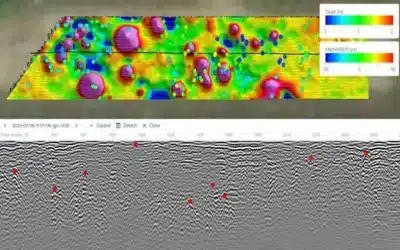
3D Terrain Analysis: Terrain datasets helps to better represent and model the terrain or elevation of project areas by integrating 3D-based mass point observations with other data sources such as 3D features and perform many types of 3D spatial analysis in the GIS using the ArcGIS 3D Analyst extension. This project enabled us to analyze the HillShade, Aspect and Slope.
HillShade: This is a technique for visualizing terrain determined by a light source and the slope and aspect of the elevation surface. It is a qualitative method for visualizing topography and does not give absolute elevation values. In appendices section, the HillShade (HS) of the project area generated from the elevation data has been presented. The red, yellow and green colors show areas with high, moderate and low HS values respectively.
Aspect: Aspect is derived from a raster surface. Aspect identifies the downslope direction of the maximum rate of change in value from each cell to its neighbours. In simplest terms, Aspect can be thought of as the slope direction. Appendix section shows the Aspect Map obtained from the field data. The red, yellow and green colors show areas with high, moderate and low Aspect values respectively.
Slope: In GIS, raster-based slope computation tools estimate the rate of change between each cell and its neighbours. Slope is calculated by comparing a certain point within a raster to that point’s neighbours. Usually a point is compared with eight of its neighbours to derive its slope. In this project, a slope map was produced as shown in Appendix 10.6. The depiction of colours implies the following: The red, yellow and green colors show areas with steep, gentle and fairly flat Slope values respectively.
Elevation Analysis
The elevation analysis entailed assessing the changes in elevation values in entire property. The highest elevation value and lowest values were identified and the differences in elevations was computed as follows. The table 2 below shows the geo-statistical analysis of elevation data.
Table 2: Analysis of Site Elevation
|
No. |
Northings (M) | Eastings (M) | Elevation (M) |
Elevation |
|
1. |
9863488.846 |
251342.732 |
1746.220 |
Highest Elevation |
|
2. |
9863558.471 |
251343.748 |
1721.702 |
Lowest Elevation |
Key Findings
The data presented in the Table 2 above gives an overview of the general elevation information of the property. The highest elevation point was found to be 1746.22m ASL and lowest elevation 1721.70m ASL. Therefore, the difference between the highest and lowest elevation was found to be 25.42 metres. Furthermore, the average elevation of the entire property was found to be 1727.53 m ASL.
The change of elevation from the main gate, through the parking to the section with buildings and swimming pool, is 0.3m in every 1.3m of horizontal distance. This implies that the sections have fairly steep slopes. On the other hand, the changes in elevation from the swimming pool downstream is approximately 0.3m in every 0.4m of horizontal distance. This implies that as one approaches downstream area there is very rapid changes in elevation for a short horizontal distance hence the sections are very steep with high gradient. So, when it rains heavily, the speed and volume of water increases significantly hence high likelihood of property destruction.
Although there are water drains on the property, drainage works is needed to control the rain water and surface run-off. Due to steep slopes on the property, the heavy rains experienced from the months October 2023 through to June 2024 had a huge negative impact and it led to destruction of trees, stone pitching works on the property hence washout of the steps and other infrastructure. Indeed, from the field observations and measurements the Elnino rains experienced had destroyed trees, crops, landscaping works among others. The rains also led to the fall of trees which destroyed the electric fence and other small trees.
Based on fieldwork done, it was also noted that the area is covered by big and small trees. The big trees have an average diameter of about 1 foot. In other sections, grass and vegetables have been grown. It is evident that some trees, vegetation and other ground features were destroyed by surface run-off. From the field topographical survey exercise, the surveyor managed to obtain the topographical data (x, y and z) covering the entire project area as per the results presented.
Conclusion
Overall, the land and topo survey exercise was conducted successfully. The objectives of the assignment were adequately achieved as per the deliverables presented. In summary, the property requires the following work to be done i.e. stone pitching, reconstruction of steps, re-terracing, planting of trees with deep tap roots and grass to prevent soil erosion. The site drainage works need to be redone considering the steep slopes and gradients on the property.
Ad: Explore the world with Expedia

Flewflew: AI solutions provider in Africa

OrbiCollect: Mobile mapping made easier!

NSE Stock Market: Buy & Sell Shares