Automate and customize GIS workflows with R and Python
[1.] Python programming
Python is one of the most popular, high-level, general-purpose and object-oriented programming language. It is used in myriad of applications including machine learning, web development, desktop applications, data analysis, task automation among others. Python is a powerful programming language that can also be used to automate GIS workflows. By automating repetitive GIS tasks, you can save time and improve efficiency of a project.
What can Python do?
- Can be used on a server to develop and deploy interactive web applications.
- Can be used alongside software to create and automate workflows.
- Can connect to database systems. It can also read and modify files.
- Can be used to handle big data and perform complex mathematics. Ideal for machine learning.
- Can be used for rapid prototyping, or for production-ready software development
In GIS, Python can be used to automate processes and workflows as follows:
- Creating scripts to process large datasets: Python can be used to create scripts that will automatically process large datasets. This can be useful for tasks such as calculating statistics, creating maps, or generating reports.
- Generating web maps: Python can be used to generate web maps that can be viewed and interacted with by anyone with an internet connection. This can be useful for sharing GIS data and results with others.
- Developing custom GIS tools: Python can be used to develop custom GIS tools that can be used to perform specific tasks. This can be useful for tasks that are not currently supported by commercial GIS software.
——-
Also read about this interesting article about: The applications of GIS in monitoring & mitigation of climate change
——-
Python programming and GIS
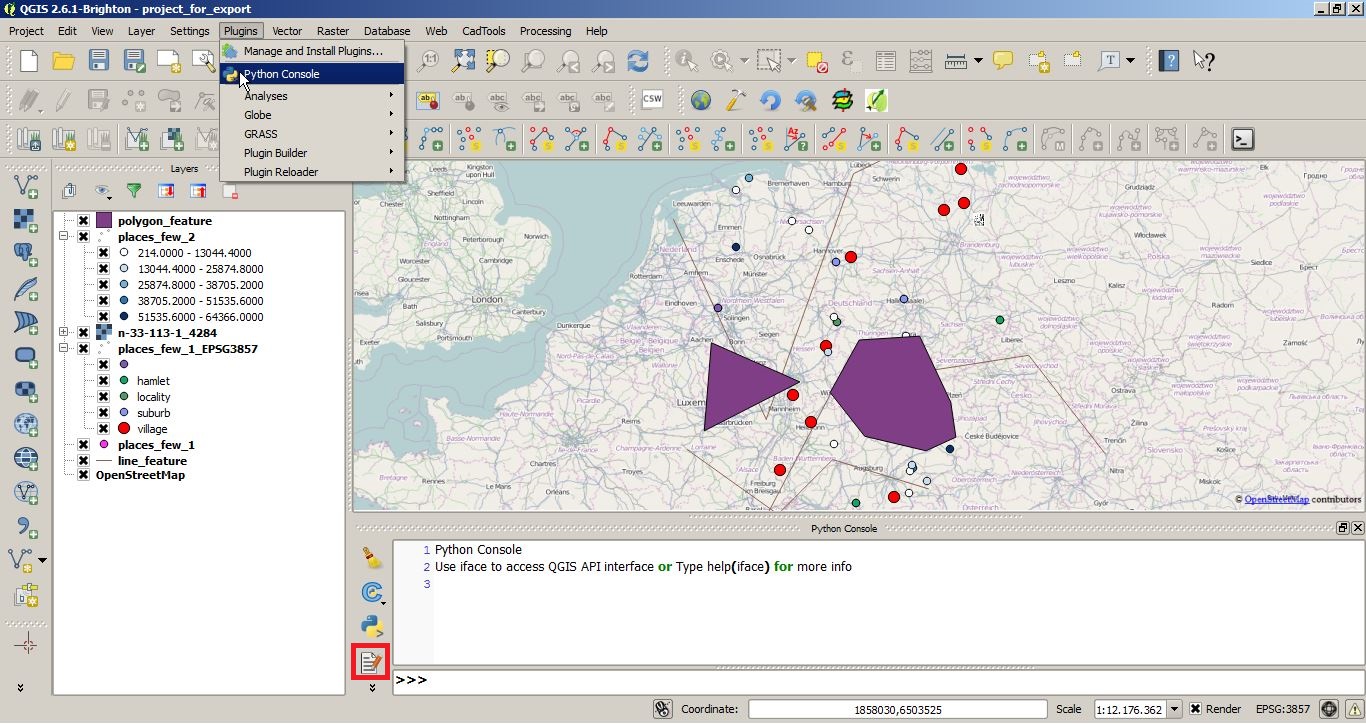 Python is a general-purpose programming language that can be used for a wide range of applications, including GIS. Python can interact with GIS software in several ways, such as scripting, automation, customization, and extension. For example, you can use Python to automate repetitive tasks, create custom tools and interfaces, or extend the functionality of existing GIS software. Some of the common Python libraries and modules for GIS are ArcPy, PyQGIS, GDAL, Shapely, and GeoPandas. To use Python with GIS software, you need to install the appropriate Python version and packages, configure the environment variables, and write or run the code in an editor or a console.
Python Libraries for GIS
If you’re going to build an all-star team for GIS Python libraries, this would be it. They all help you go beyond the typical managing, analyzing, and visualizing of spatial data. That is the true definition of a Geographic Information System.
1. Arcpy
If you use Esri ArcGIS, then you’re probably familiar with the ArcPy library. ArcPy is meant for geoprocessing operations. But it’s not only for spatial analysis, it’s also for data conversion, management, and map production with Esri ArcGIS.
2. Geopandas
Geopandas is like pandas meet GIS. But instead of straightforward tabular analysis, the Geopandas library adds a geographic component. For overlay operations, Geopandas uses Fiona and Shapely, which are Python libraries of their own.
3. GDAL/OGR
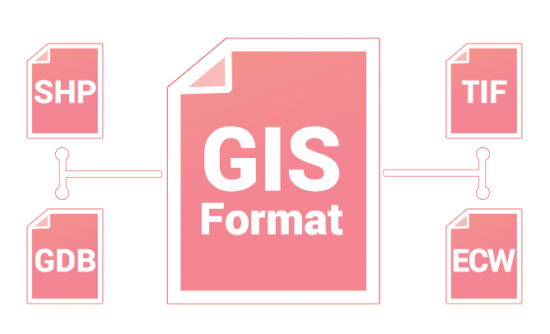 GDAL/OGR library is used for translating between GIS formats and extensions. QGIS, ArcGIS, ERDAS, ENVI, GRASS GIS and almost all GIS software use it for translation in some way. At this time, GDAL/OGR supports 97 vector and 162 raster drivers.
4. RSGISLib
The RSGISLib library is a set of remote sensing tools for raster processing and analysis. To name a few, it classifies, filters, and performs statistics on imagery. My personal favorite is the module for object-based segmentation and classification (GEOBIA).
5. PyProj
The main purpose of the PyProj library is how it works with spatial referencing systems. It can project and transform coordinates with a range of geographic reference systems. PyProj can also perform geodetic calculations and distances for any given datum.
[2.] R Programming
R programming is a free, open-source language for statistical computing and data visualization. Statisticians use it for everything from exploratory analysis, and data mining to graphing. Despite ArcGIS and Q-GIS being mostly Python-based, both have extensions to work with R.
R programming and GIS
R is a statistical programming language that can be used for data analysis, visualization, and modeling. R can also be used for GIS applications, such as spatial statistics, geostatistics, spatial econometrics, and spatial machine learning. R can integrate with GIS software in different ways, such as importing and exporting spatial data, calling GIS functions, or embedding R scripts. Some of the common R packages and functions for GIS are sp, sf, raster, rgdal, maptools, and rgeos. To use R with GIS software, you need to install the appropriate R version and packages, load the libraries, and write or run the code in an editor or a console.
Integration of R libraries
The usage of R in GIS is growing because of its enhanced capabilities for statistics, data visualization, and spatial analytics. Here are some important fields that often require the use of R.
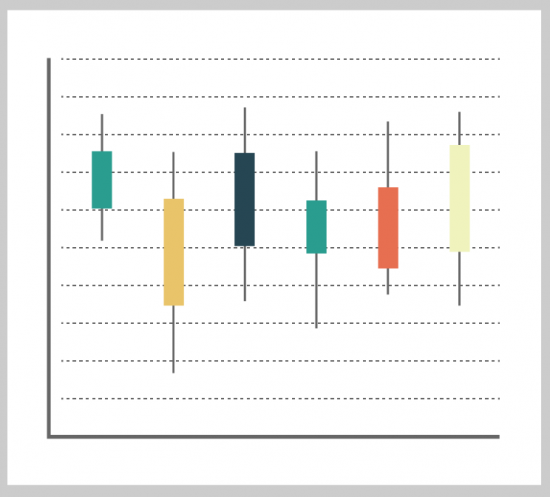 Data Visualization – By leveraging packages like ggplot2, GIS users use R mainly for statistical analyses and plotting data. There are various mapping and data visualization packages like tmap and ggplot2. If you’re already familiar with these tools, they’re fairly straightforward for visualizations.
Table Operations – You can perform some powerful table operations with both Python and R. But you can’t underestimate some of the packages available in R. For example, tools like dplyr are intuitive to use and give flexibility for data manipulation.
Data Support – Not only does R support spatio-temporal arrays (data cubes), but it also supports tools like tidycensus to obtain census bureau data. For anyone working with government data, R offers a package to help with these types of trivial tasks.
Why not use Python?
While Python can do most of what R can do, we typically can use a two-pronged approach in GIS. Because you can do most work in both languages, it usually comes down to whatever you feel most comfortable using. While R is good at visualization and statistical analysis, Python is particularly good at working with file systems, networks, web scraping, and automation. This is why Python is the default programming language for Q-GIS and ArcGIS, instead of R.
While matplotlib is an alternative to ggplot2, some data analysts prefer one over the other. You can use both R and Python to make maps. Albeit, most are rudimentary without capabilities to customize them as you can in GIS software. But they’re still functional maps. For more advanced spatial analysis, there are libraries like PySal such as detecting clusters, outliers, and hot spots.
How can you use R in GIS?
It’s becoming more common practice to use R within your GIS workflow. Whether it’s for computational analysis or data visualization, there always seems to be a usage of R.
i) R-ArcGIS Bridge
The purpose of R-ArcGIS Bridge is that you can store your vector and raster data in ArcGIS. Then, you can directly access it in R and return R objects back into ArcGIS native data types. At the same time, you can also use powerful spatial analysis and visualization tools in ArcGIS and seamlessly go back and forth to R. This makes it ideal for R and ArcGIS users to use in R Notebooks.
ii) Processing R Provider (Q-GIS)
If you’re looking for an open-source GIS software solution to leveraging the open-source statistical language of R, then the Processing R Provider is likely what you’d be looking for in Q-GIS. This plugin allows you to write and run R scripts natively inside Q-GIS. In order to use this plugin, you will have to install R on your machine with the correct R packages added beforehand.
——————————————————————————————————————————————————————————
Training course – Introduction to GIS and R programming
R has a full library of tools for working with spatial data. This includes tools for both vector and raster data, as well as interfacing with data from other sources (like ArcGIS) and making maps. These tutorials — which build off Claudia Engel’s excellent GIS in R tutorials — are designed for users with some familiarity with R, but require no knowledge of spatial analysis. If you aren’t used to working with R, you will probably want to spend some little time familiarizing yourself with the language before starting this series. (Here’s a good set of R tutorials if you need them).
Each tutorial is divided into several parts (to be done in sequence), and include a zipped folder of data for exercises. In addition, cheatsheets are provided which may be of help in remembering the various commands you will frequently use. Each tutorial is meant to take ~1.5 hours, not including software installation. These tutorials have a share-and-share-alike Creative Commons license, so please feel free to use and modify as you see fit. You can find rmarkdown source files on github here. There is a variety of important R command cheatsheets. In fact, learning GIS in R involves learning both concepts and vocabulary. Here are some cheatsheets to help with the later.
Tutorial 1: Introduction to GIS Data Types
The aim of Tutorial 1 is to provide users with a solid understanding of how R thinks about spatial data. It covers some material that users will not need to deal with on a day to day basis, but by providing an understanding of the organization of each library, it is my hope they will help users avoid problems, solve problems when they arise, and to know how to identify the sources of problems when they need to ask others for guidance. Here is the data for Tutorial 1 with parts 1.1, 1.2 and 1.3 as detailed below.
Tutorial 1.5: Background on Projections, Coordinate Reference Systems, and Geographic Coordinate Systems
Concepts like “projections” and “coordinate systems” are tricky on their own, and this trickiness is made all the worse by the fact there’s incredible inconsistency in how these terms are used. In this handout, I lay out the two main concepts you need to know, then provide an overview of what different programs and communities actually mean when they use terms like “projection”.
Tutorial 2: Combining Multiple Data Sources
Rarely can the answers we seek be found in a single data-set. Here are a set of tools for combining multiple datasets through methods like spatial joins, distance calculations, etc. Here is the Data for Tutorial 2 with parts 2.0, 2.1 and 2.2 as detailed below.
- Part 2.0: Setup instructions
- Part 2.1: Spatial Joins (Here is also a supplementary Doc on lapply and sapply).
- Part 2.2: Geometric Manipulations: Buffers, Distances, Intersections, etc.
Tutorial 3: Making Cartographic Maps
Visualization is central to sharing our results. This tutorial covers the basics of making visually appealing and informative maps in R. Here is Data for Tutorial 3 with parts 3.1 and 3.2 as detailed below.
Tutorial 4: Geocoding (Very Short) and Background on APIs
How to convert addresses and location names to latitudes and longitudes from R using the Google Maps API. Also some optional background on what an API is, and how most web APIs work. Here is Data for Tutorial 4 with part 4 as detailed below.
Tutorial 5: Spatial Statistics and Surface Interpolation
Libraries for spatial statistics like Ripley’s K, Moran’s I, Spatial Auto-Regressive Lag regressions, Error Auto-Regressive regressions, etc, as well as libraries for surface interpolation via IDW and Kriging. Here is Data for Tutorial 5 with part 5 as detailed below.
Tutorial 6: Combining Network Analysis with GIS
This tutorial introduces network analysis concepts, and provides an overview of how to combine a specific type of network analysis — community detection — with GIS to visualize community structures in space. Data for Tutorial 6 with part 6 as detailed below.
Tutorial 7: Need more performance?
A brief overview of some tools for getting better performance. For example, tutorial includes an example of how to find the nearest neighbor in one DataFrame for each observation in a second DataFrame without calculating every single distance and taking the minimum.
If you want to create interactive maps, ipyleaflet is a fusion of Jupyter notebook and Leaflet. You can control an assortment of customizations like loading basemaps, geojson, and widgets. It also gives a wide range of map types to pick from including choropleth, velocity data, and side-by-side views. Just like ipyleaflet, Folium allows you to leverage leaflet to build interactive web maps. It gives you the power to manipulate your data in Python, then you can visualize it with the leading open-source JavaScript library.


