Geographical Information Systems (GIS), remote sensing and mapping play a vital role in climate change monitoring, adaptation and mitigation efforts. GIS enables collection, analysis, storage, dissemination and better understanding of climate-related data, hence informed decision-making by various climate adaptation actors. GIS plays an enabler role in the development of spatially-effective strategies to reduce greenhouse gas emissions and adapt to the changing climate. As well, the developments in GIS have transformed how researchers in a variety of fields gather and analyze information about the world around us.
 GIS modelling is employed in creating and visualizing climate models that simulate the effects of climate change on various geospatial aspects such as temperature, wind, precipitation, and sea level. The researchers often gain valuable insights in realms such as geology and meteorology, by gathering and exploring remotely sensed data with geospatial tools. By integrating GIS and climate change studies, spatial problem-solvers can seize the opportunities to handle climate change shortcomings and make a difference in the lives of future generations. Some of the ways that researchers and governments are using GIS technology for providing information on climate change include but not limited to the following:
- Locating areas with high temperatures or especially unpredictable in comparison with the regional and global average.
- Studying and discovering how natural atmospheric processes might affect climate change hence global warming.
- Creating robust GIS models to show how a warming climate might impact the ecology of various regions in global context.
- Evaluating and examining the relevance of shifts in land use and land cover, such as the removal of trees/deforestation and the impacts on climate change.
- Visualizing multiple factors with the potential to affect weather patterns, crop growth, industry, and wildlife among others.
Geospatial tools offer the location perspective on evolving weather patterns, rising sea levels and growing risks to human health. The informative visualizations using GIS dashboards show these developments in ways that scientists and non-experts alike can understand. In turn, local governments, non-profits organizations and other bodies may apply what they learn from geographic models to set strategy and make informed decisions.
What is the role of GIS in climate change adaptation?
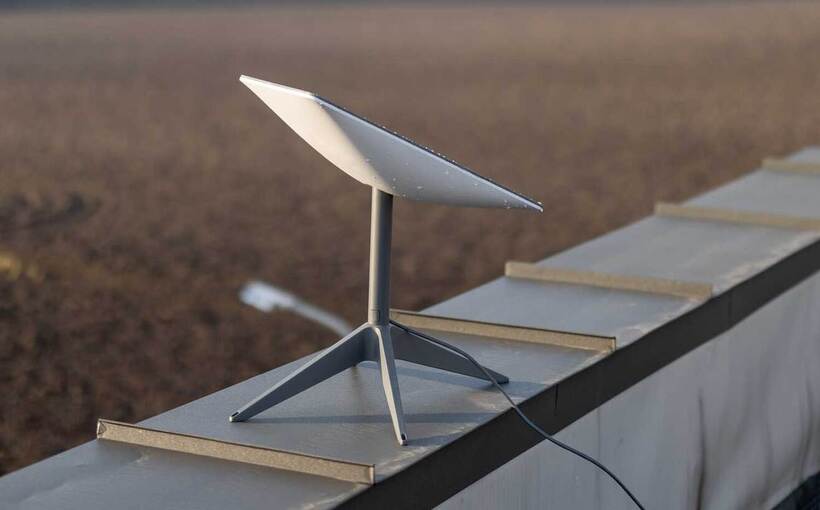
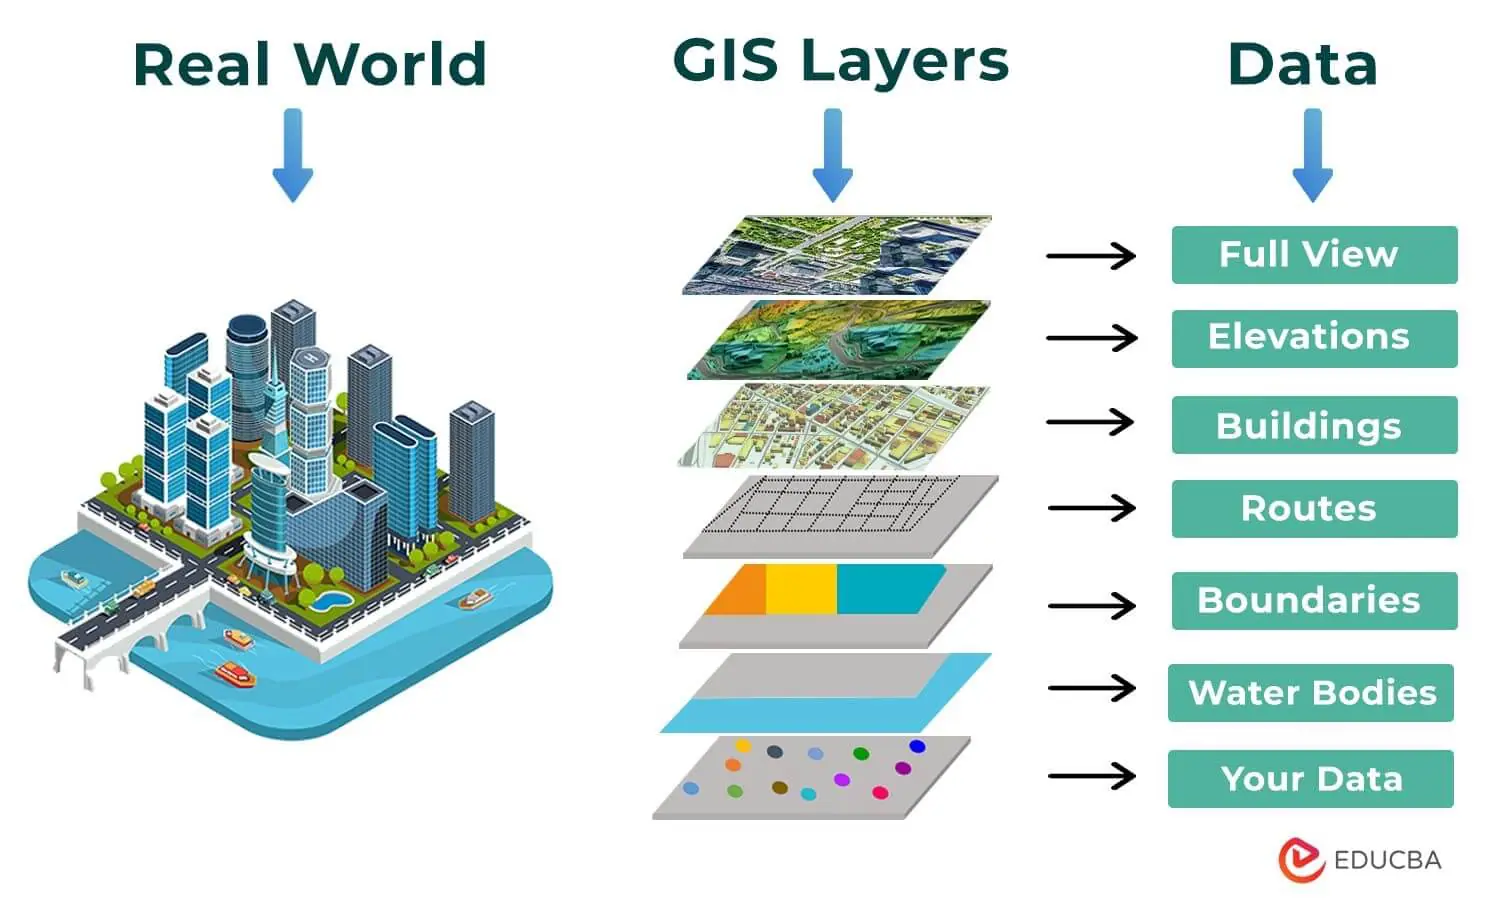
GIS and remote sensing allows for the collection, management, and visualization of a wide range of geospatial data related to climate, such as temperature patterns, precipitation, sea level rise, and green house gas emissions sources. The robust GIS tools such as infographs and dashboards enable the visualization of climate data on maps hence helping the researchers and policymakers understand climate trends and patterns over time.
In emission inventories, GIS can be used to create detailed gas emission inventories, which are essential for tracking the sources and quantities of greenhouse gas emissions. This information is critical for setting emissions reduction targets and monitoring progress. The application of geospatial technologies in climate science can be utilized in assessing the current state of greenhouse gas emissions, land use/land cover, forestry and other critical factors.
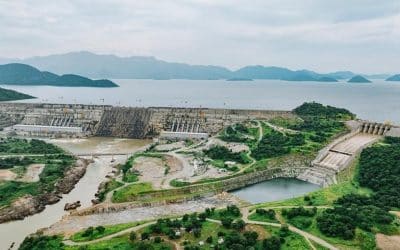
The renewable energy planning can be done in GIS by helping in the identification of suitable locations for renewable energy projects such as wind farms and solar installations. By analyzing factors like sunlight, wind patterns, and proximity to infrastructure, GIS can optimize the placement of these projects for maximum efficiency. With GIS, it is also possible to determine the best locations for harnessing alternative sources of energy. Mapping resources, such as wind and solar energy, supports governments and developers who want to invest in alternative fuel sources. As well, carbon sequestering is an important part of maintaining a green community.
In urban planning and transportation, GIS is used in urban planning to optimize transportation networks, reduce congestion, and improve public transportation systems. This can lead to reduced emissions from vehicles and more sustainable urban development. Understanding the impact of climate change on urbanization has become increasingly important as climate warming increases. According to UN-Habitat statistics, the effects of urbanization and climate change are converging in dangerous ways. The global warming is likely to reach 1.5°C between the year 2030 and 2052, and approximately 3°C in 2100 based on the current national government commitments. This will have disastrous impacts on many cities.
Read also this interesting article on: How the World will look like 30 years from today!
Forestry and Land Use Management using GIS enables instrumental in monitoring and managing forests and land use changes. It helps track deforestation, afforestation, and reforestation efforts, which are crucial for carbon sequestration and mitigating climate change. Climate adaptation planning using GIS aids in identifying areas vulnerable to climate change impacts, such as sea level rise and extreme weather events. It helps planners and policymakers develop strategies for adaptation, including the construction of resilient infrastructure. 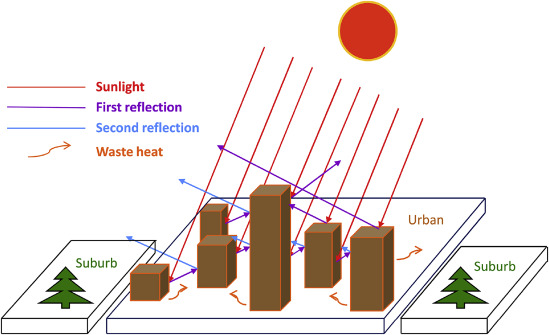
GIS-based natural resource management assists in the sustainable management of natural resources like water, soil, and fisheries, which are sensitive to climate change. Proper resource management can help communities adapt to changing conditions and reduce environmental stressors. GIS is used in disaster risk reduction and management. It helps predict and assess the impacts of climate-related disasters like hurricanes, floods, and wildfires, allowing for better preparedness and response.
In public awareness and education, maps and visualizations created with GIS can communicate complex climate data to the public in a more understandable way. This helps raise awareness about climate change and encourages informed decision-making at the individual and community levels. In policy support, GIS provides policymakers with spatial data and analysis tools to inform climate policies and regulations. It enables the evaluation of the effectiveness of mitigation measures and the identification of areas requiring targeted interventions.
Available GIS Training: GIS for Climate Change Adaptation and Mitigation Course
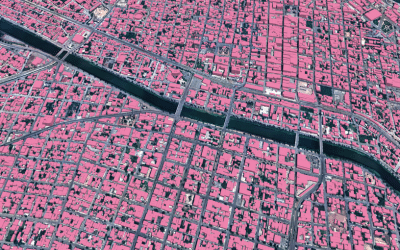
Urbanization has profoundly affected the environment and climate all over the world and has intensified the climate change impacts. Many organizations have built actionable climate change solutions using location intelligence and GIS based on detailed risk analysis and response.
Globally, according to IPCC, 2019, the way in which humans utilize land accounts for approximately 23% of anthropogenic greenhouse gas emissions. Land use and land cover change as a source of emissions is unique since it can produce, as well as offset, large quantities of greenhouse gases through carbon sequestration – a process of capturing and storing atmospheric carbon dioxide. It is one method of reducing the amount of carbon dioxide in the atmosphere with the goal of reducing global climate change.

Ad: Explore the world with Expedia

Flewflew: AI solutions provider in Africa

OrbiCollect: Mobile mapping made easier!

NSE Stock Market: Buy & Sell Shares