We have developed a complete GIS Based Accidents and Incidents Reporting System in Kenya and Africa. A GIS-based accidents and incidents reporting platform provides a modern, spatially-aware solution for capturing, analyzing, and visualizing events such as road accidents, environmental hazards, or utility failures. By integrating real-time geospatial data with user-friendly interfaces, the platform empowers organizations and agencies to make informed decisions and respond rapidly to critical events. It leverages mapping tools, geocoding, and spatial analytics to track incident trends and pinpoint high-risk zones.
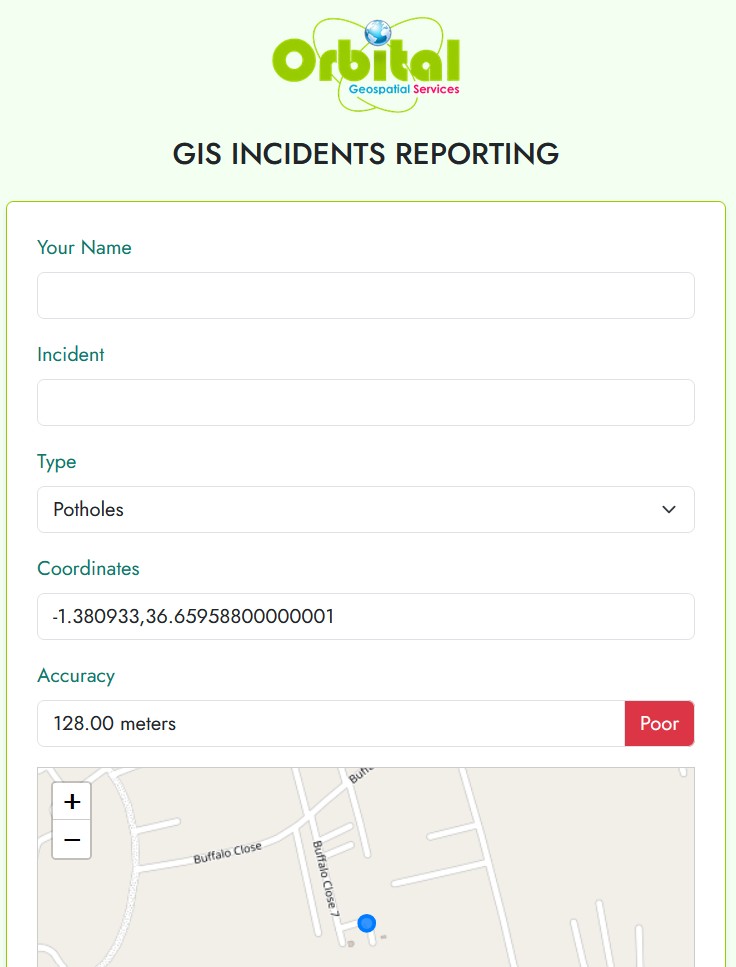
At the core of the platform is an intuitive web and mobile interface that allows users—including the general public, field officers, or internal teams—to report incidents by capturing location, description, photos, and media evidence. Reports are automatically geo-tagged using GPS or map selection, and optionally verified by administrators before being published to the system. This promotes transparency and inclusivity while ensuring data accuracy and relevance.
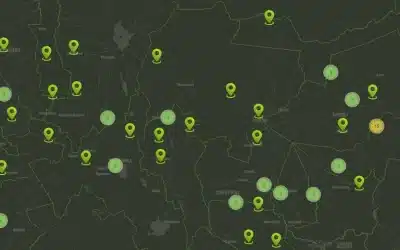
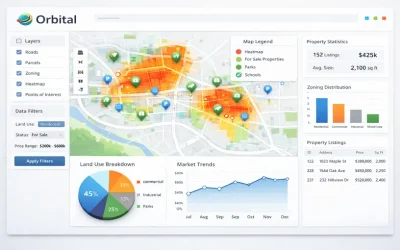
Once collected, the spatial incident data is displayed on interactive maps using tools like Leaflet, Mapbox, or ArcGIS Online. Users can filter incidents by type (e.g., traffic, fire, infrastructure), date, or severity, and view dynamic heatmaps or cluster maps that reveal patterns over time. Integration with satellite basemaps and GIS layers (e.g., roads, hospitals, utility lines) allows users to visualize incidents in a broader spatial context, supporting both tactical response and long-term planning.
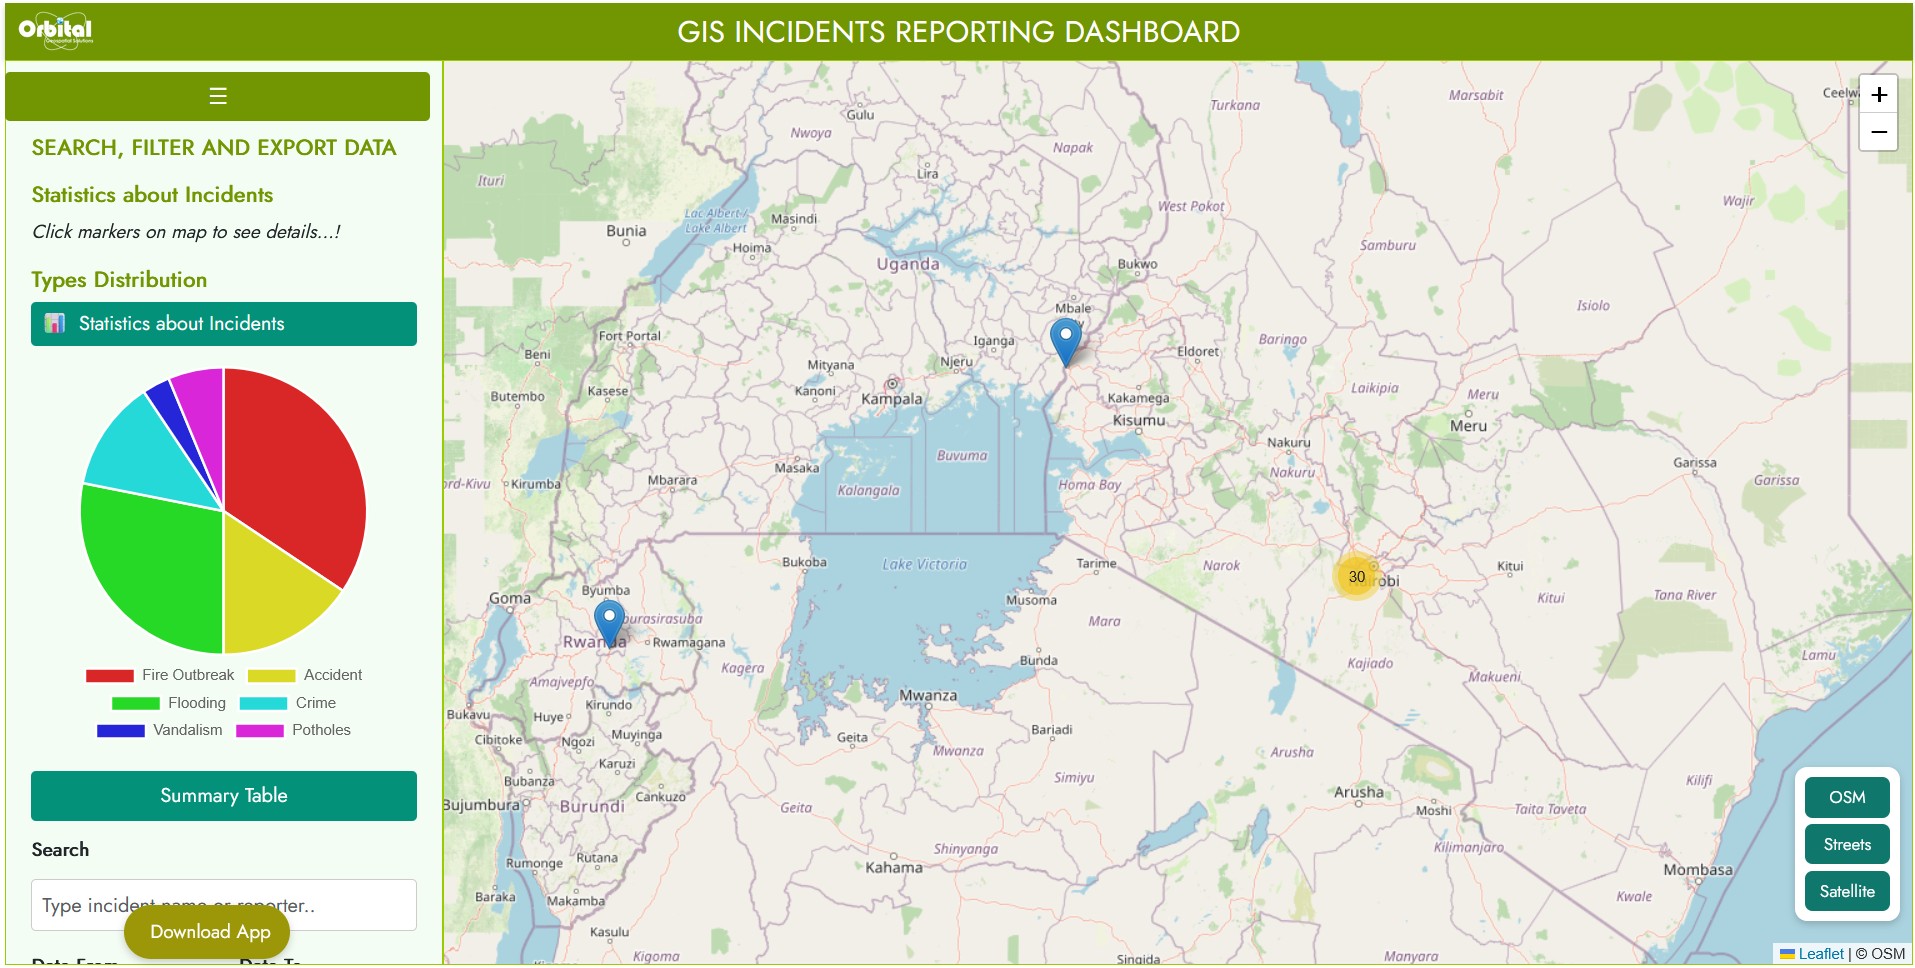
GIS Based Incidents Reporting Solution Developed by Orbital Africa
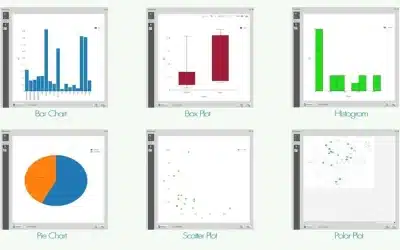
The backend system includes powerful analytical tools that generate reports, charts, and dashboards. Administrators can monitor key indicators such as response time, incident frequency, and location-based risk levels. These insights can be exported or shared with stakeholders to inform policy changes, infrastructure investments, or public safety campaigns. Additionally, the platform can be integrated with external systems such as emergency dispatch, SMS alerts, or environmental sensors.
In summary, a GIS-based accidents and incidents reporting platform bridges the gap between ground-level data collection and strategic decision-making. It enhances situational awareness, improves coordination between responders and agencies, and ultimately helps save lives and resources. Whether deployed in urban areas, industrial zones, or rural communities, this platform is a scalable, flexible solution for modern incident management.
The Incidents Mobile Interface
Use of Incidents App in Utility Industry
Utility companies face unique challenges when it comes to tracking, managing, and responding to field incidents—ranging from electrical faults and gas leaks to infrastructure damage and employee safety events. A GIS-based accidents and incidents reporting platform provides a comprehensive, location-aware solution that enables real-time reporting, visualization, and analysis of such events. By centralizing incident data spatially, utilities can optimize operations, reduce downtime, and enhance safety across their networks.
The platform allows field teams, contractors, and even the public to report incidents directly from their mobile devices or desktop systems. Each report is geotagged using GPS or interactive maps and can include detailed information such as incident type, photos, video evidence, affected assets, and severity levels. This ensures that every event is accurately located and contextually understood, streamlining coordination and response times.
Using GIS technologies like ArcGIS, Leaflet, or Mapbox, reported incidents are displayed on dynamic maps that support filtering by asset type (e.g., substations, pipelines, transformers), location, or time. Clustering and heatmapping reveal hotspots of recurring issues—such as fault-prone lines or high-risk maintenance zones—enabling proactive intervention. Utility asset layers can also be overlaid to assess the impact on critical infrastructure and nearby customers.
On the administrative side, the system provides powerful analytics and dashboards that support operational decisions. Managers can track incident trends, analyze mean time to response (MTTR), monitor compliance with safety standards, and generate reports for internal use or regulatory submission. Integration with SCADA, ERP or Outage Management Systems (OMS) further strengthens the operational workflow by enabling automated alerts and resource allocation.
Overall, a GIS-based incidents and accidents platform for utilities transforms reactive maintenance into proactive asset management. By tying every incident to its geographic context, it empowers utility providers to enhance system reliability, reduce response times, and improve public and worker safety. Whether deployed by power distributors, water boards, or gas utilities, this solution is a critical tool in modern utility operations.
Use of Incidents App in Disaster Management Industry
A GIS-based incidents reporting platform offers disaster management agencies the ability to monitor, analyze, and respond to emergencies with greater precision and speed. Whether responding to floods, wildfires, earthquakes, or hazardous material spills, this platform serves as a critical tool for spatially-informed decision-making.
The platform enables field officers, emergency responders, and civilians to report incidents through mobile or web interfaces. Each report is geotagged with accurate GPS coordinates and can include photos, videos, and key metadata such as severity, type, and affected population. This ensures that data is collected in real time from the ground, even in rapidly evolving crisis environments, allowing command centers to assess impact areas with immediate clarity.


The interactive maps built on GIS tools like ArcGIS Online or Leaflet visualize reported incidents, showing the distribution and density of events across affected areas. Layer integration—such as evacuation zones, shelter locations, floodplains, or infrastructure—adds essential context to each report. Responders can prioritize zones of concern, allocate resources more efficiently, and route aid and personnel to critical sites using live map intelligence.
The backend includes analytical dashboards that help agencies monitor ongoing events, compare current incidents with historical patterns, and evaluate response effectiveness. The system supports exporting data for reporting to national disaster bodies or humanitarian partners, ensuring accountability and transparency. Integration with early warning systems, weather feeds, and SMS/email alert systems enhances preparedness and real-time response capabilities.
In summary, the GIS-based incidents and accidents platform strengthens every stage of the disaster management cycle—from preparedness and response to recovery and resilience planning. It equips authorities with the tools to visualize danger zones, coordinate efforts, and protect lives and property through smarter, spatially-driven emergency management.
Ad: Explore the world with Expedia

Flewflew: AI solutions provider in Africa

OrbiCollect: Mobile mapping made easier!

NSE Stock Market: Buy & Sell Shares

Join Binance and Let us win together!

AGM 6th Edition: Jan-Apr 2025