A GIS Dashboard features a user-friendly, interactive web application GIS platform that visualizes projects data on a map; infrastructure, demographics and economic indicators through dynamic mapping tools. This allows users to navigate infrastructure projects and service areas through an intuitive, layer-based mapping system.
A GIS dashboard allows users to monitor project status, analyze trends and make informed decisions. The projects dashboards integrate GIS data with other relevant information like project details, budget status as well timelines.

The GIS Projects Reporting Dashboard was developed as a web-based solution to streamline the collection, storage, visualization, and analysis of spatial and project-related data. The system integrates MySQL, PHP, AJAX, JavaScript, and CSS to provide an interactive, scalable, and user-friendly platform for managing GIS-driven projects.
Core Features
-
Data Management (MySQL + PHP)
-
Secure database design for storing spatial and project records.
-
Backend services built with PHP (PDO) to handle CRUD operations (create, read, update, delete).
-
Validation and role-based access to ensure data integrity and controlled user management.
-
-
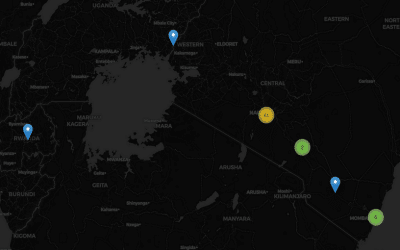
Interactive GIS Visualization (JavaScript + Leaflet/Google Maps APIs)
-
Real-time rendering of project locations on a map.
-
Support for GeoJSON and shapefile/CSV/GeoDatabase data imports.
-
Features like clustering, heatmaps, thematic mapping, and layer toggles.
-
Popups displaying project details, photos, and videos directly on the map.
-

-
Dynamic Dashboard (AJAX + JS)
-
Asynchronous data loading using AJAX for smooth user experience.
-
Filter and search tools (by project type, date, status, region, etc.) without reloading the page.
-
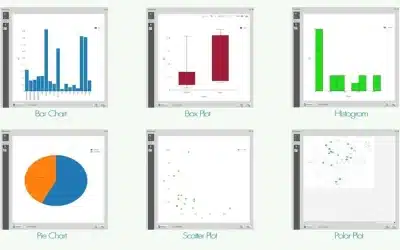
Charts and graphs (Google Charts / Chart.js) for statistical insights into project distribution and progress.
-
-
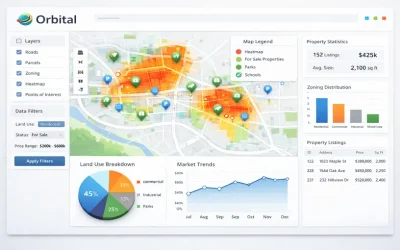
User Interface (Bootstrap + CSS)
-
Responsive, mobile-friendly dashboard layout.
-
Sidebar navigation for quick access to modules (Projects, Reports, Parcels, Owners, etc.).
-
Modern design with custom CSS styling and icons for clarity.
-

Reporting & Analysis
-
Export capabilities (CSV, Excel, PDF) for project data.
-
GeoCharts and line/bar charts for visual reporting.
-
Real-time statistics on project counts, categories, and spatial coverage.
Benefits
-
Centralized GIS project reporting and monitoring.
-
Improved decision-making with visual analytics and spatial insights.
-
Faster data entry and updates through AJAX-based interactions.
-
Scalable architecture for integrating new datasets, project types, or modules.

Ad: Explore the world with Expedia

Flewflew: AI solutions provider in Africa

OrbiCollect: Mobile mapping made easier!

NSE Stock Market: Buy & Sell Shares

Join Binance and Let us win together!

AGM 6th Edition: Jan-Apr 2025