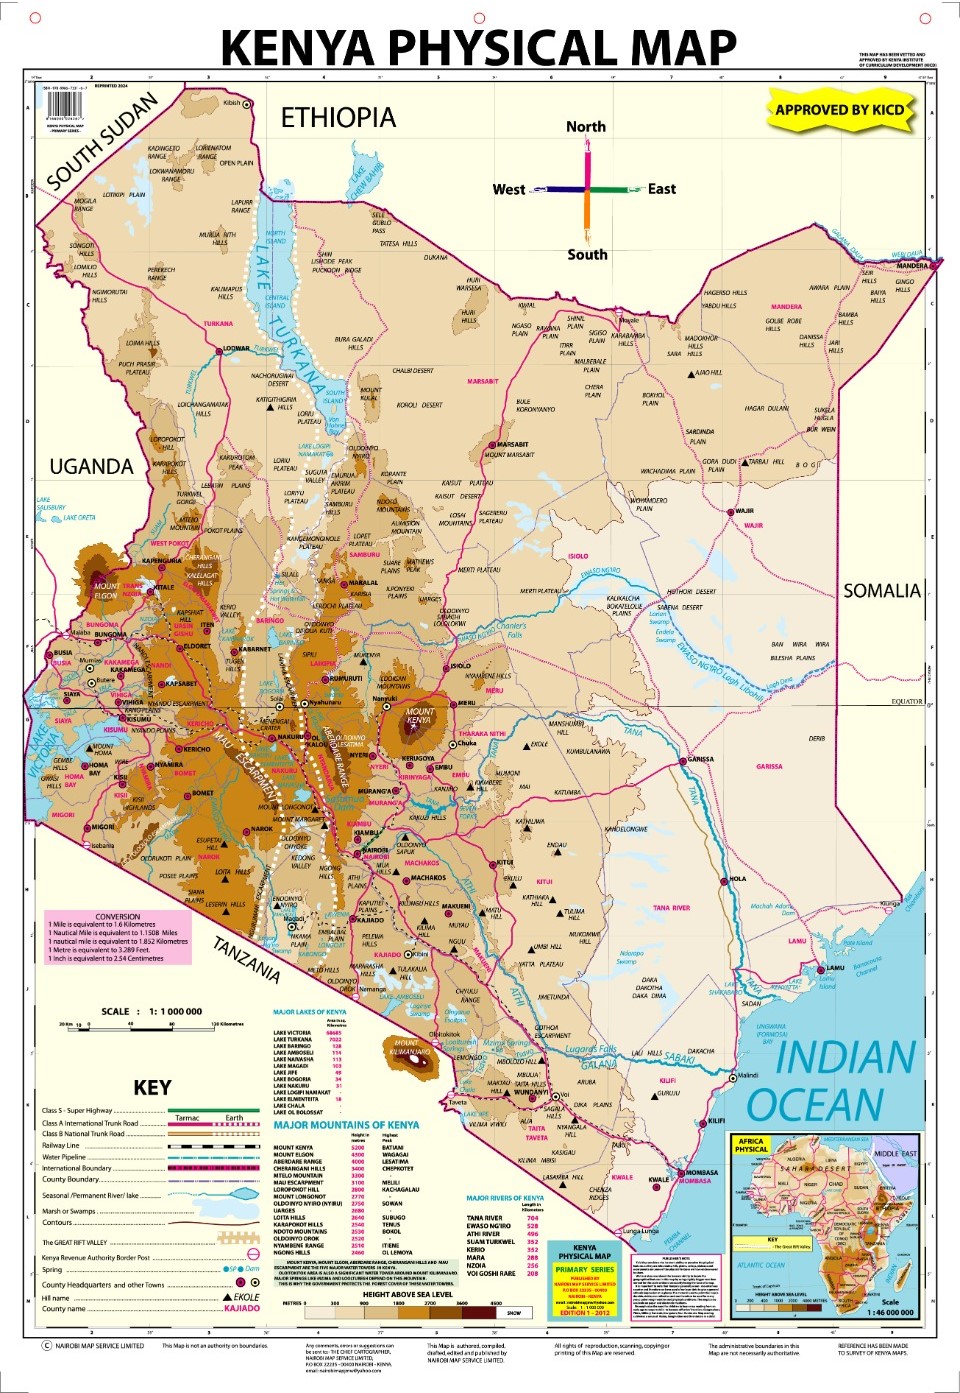
Quantum GIS (QGIS) is an open-source GIS software that allows users to create, edit, visualize and analyze spatial data. QGIS can be used to create maps i.e. cartography. In the simplest definition, Cartography is the art, science, and technology of creating maps, charts, and other visual representations of spatial data.
It involves the design, production, and dissemination of maps that communicate geographic information in a clear, accurate, and visually appealing manner. Cartography plays a crucial role in various fields including land survey, meteorology, geography, urban planning, environmental science, navigation, and many others.
Aspects of QGIS Cartographic Map Production
Map design: Cartographers design maps to effectively communicate spatial information to their intended audience. This involves making decisions about map elements such as scale, projection, symbology, colors, labels, and layout to optimize readability and usability.
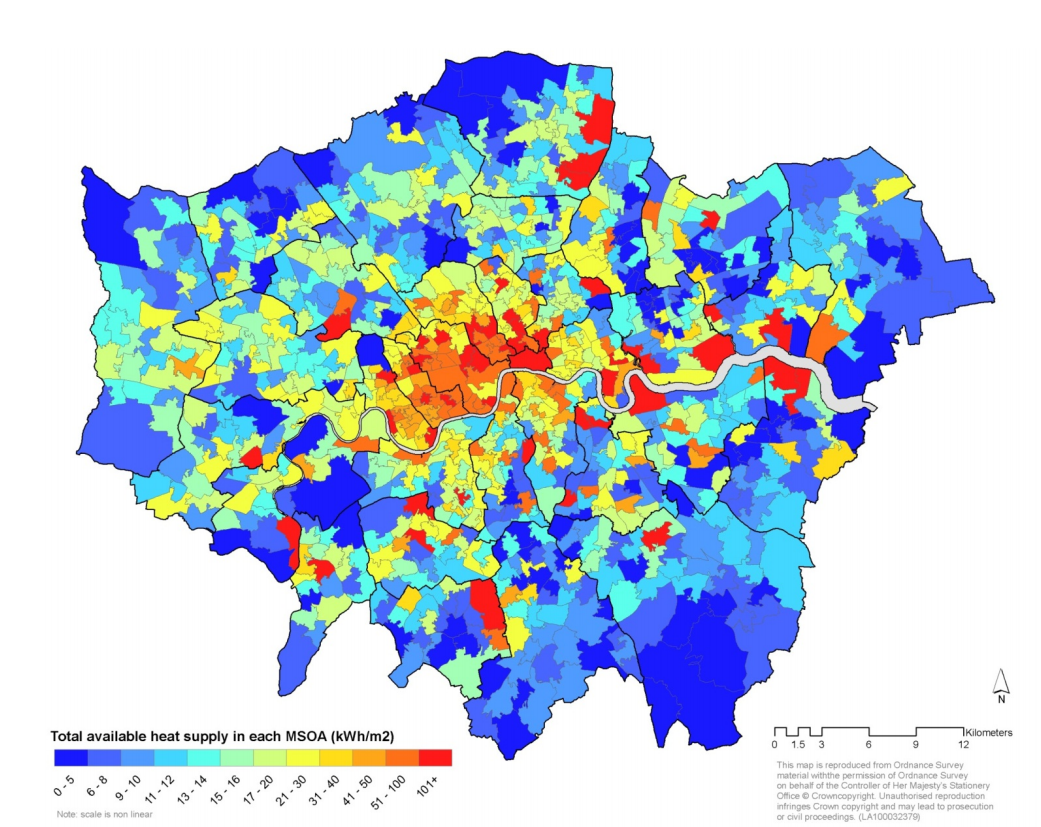
Data representation: Cartographers use symbols, colors, and graphical elements to represent different geographic features and attributes on maps. They must carefully select appropriate representations to convey information accurately and intuitively.
Spatial analysis: Cartographers often perform spatial analysis to derive insights from geographic data and identify patterns, relationships, and trends that can be represented on maps. This may involve overlay analysis, terrain analysis, clustering, and other spatial analysis techniques.
Map projection: Cartographers select map projections that best suit the purpose and characteristics of their maps. Map projections are mathematical transformations used to represent the three-dimensional surface of the Earth on a two-dimensional map.
Georeferencing: Cartographers georeference maps by assigning spatial coordinates to map features, enabling them to be accurately positioned and integrated with other geographic datasets in a common spatial framework.
Map Production: Cartographers use various tools and technologies to produce maps, ranging from traditional methods like pen and paper to digital cartography using Geographic Information Systems (GIS) software. Digital cartography allows for greater flexibility, automation, and precision in map production.
Map use and interpretation: Cartographers consider the intended audience and purpose of maps when designing them, ensuring that they are accessible and understandable to users. Cartographers may also provide supplementary information and context to aid in map interpretation.
Cartographic standard: Cartographers adhere to established standards and conventions for map design and production to ensure consistency, accuracy, and interoperability of maps across different applications and contexts.
Key Map Elements
- Map Title
- Legend or Key
- Scale Bar
- North Arrow
- Inset Map (optional)
- Scale
- Grid or Graticule
Step-by-step Guide of creating a map in Q-GIS
Step 1: Install and Open QGIS
Download and install QGIS from QGIS official website. Then open Q-GIS Desktop after installation.
Step 2: Add Base Layers (Raster or Vector Data)
- Click Layer > Add Layer > Add Raster Layer.
- Click Browse, select your raster file (e.g.,
.tif,.jpg), and click Open. - Click Layer > Add Layer > Add Vector Layer.
- Click Browse, select your vector file (
.shp,.geojson, etc.), and click Open. - The data should now appear in the Layers Panel.
Step 3: Style and Symbolize the Map
- Right-click on the layer and choose Properties.
- Go to the Symbology tab.
- Choose Categorized or Graduated to colorize based on attributes.
- Adjust colors, line thickness, and labels as needed.
- Click Apply > OK.
Step 4: Add Labels to Features
- Right-click on the layer > Properties > Labels tab.
- Select Single Labels and choose an attribute (e.g., place names).
- Customize font size, color, and placement.
- Click Apply > OK.
Step 5: Create the Layout for Map Printing
- Go to Project > New Print Layout and name it.
- Click Add Map from the layout toolbar, then drag to place the map.
- Add additional map elements:
- Scale bar: Layout Panel > Add Item > Scale Bar.
- North arrow: Layout Panel > Add Item > North Arrow.
- Legend: Layout Panel > Add Item > Legend.
- Title & labels: Layout Panel > Add Item > Text.
Step 6: Export the Final Map
- Click Layout > Export as PDF, PNG, or JPG.
- If exporting as PDF, click Layout > Export as PDF.
- In the Export Settings, set:
- Resolution (DPI): Set 300 or 600 DPI for high-quality prints.
- Vector Options: Enable “Save as vector PDF” (for sharp texts and symbols). Finally, click Save and export your PDF.
Map production in Q-GIS involves creating high-quality maps by integrating spatial data, applying cartographic styles, and exporting the final design for print or web use.
The users can add raster and vector layers, style them with colors and labels, and use the Print Layout tool to arrange map elements like scale bars, legends, and north arrows.
Q-GIS supports various symbology options, layer blending, and annotation tools, allowing for professional-grade cartographic outputs.
Once the map design is complete, it can be exported in high-resolution formats such as PDF, PNG, or SVG for printing or as an interactive web map (HTML/GeoJSON) using plugins like qgis2web or Lizmap.
Users can also automate map production with Atlas to generate multiple maps from a dataset dynamically. With its open-source flexibility and extensive customization options, Q-GIS is a powerful tool for producing detailed and visually appealing maps for different applications.
Ad: Explore the world with Expedia

Flewflew: AI solutions provider in Africa

OrbiCollect: Mobile mapping made easier!

NSE Stock Market: Buy & Sell Shares

Join Binance and Let us win together!

AGM 6th Edition: Jan-Apr 2025